
93/100
awesome-monitoring
List of tools for monitoring and analyze everything
Browse the latest quality-filtered tools added to YunoDB from verified public project data.
14493 tools
List of tools for monitoring and analyze everything

🦀🌡️ Real-time system monitor for Apple Silicon Macs (M1–M5). No sudo. TUI, JSON/Prometheus metrics server, and Rust library.

A Prometheus exporter and a REST API server to export metrics of compute units of resource managers like SLURM, LSF, Openstack, k8s

Web interface for managing Haproxy, Nginx, Apache and Keepalived servers

Patchman is a Linux Patch Status Monitoring System

Handle errors in a simple, stable, consistent way

Live top-style monitor for Claude Code sessions

Networks, Applications and Event Monitor

An extensible Java library for HTTP request and response logging

Modern, customizable web frontend for Collectd. Visualize system metrics through a responsive dashboard, deploy in minutes with the standalone Python server, or

Plasmoid for monitoring CPU, memory, network traffic, GPUs and disks IO.

A simple and fast dashboard for Kubernetes

🚀 Practical and document place for DevOps toolchain

Suzaku (朱雀) is a sigma-based threat hunting and fast forensics timeline generator for cloud logs.

A golang implementation of endlessh (SSH tarpit) exporting Prometheus metrics, visualized by a Grafana dashboard.

Aplicação web para mapeamento ethernet. Software em PHP para monitoramento de dispositivos de rede com o protocolo SNMP v(1/2c/3).

Automatic CPU speed & power optimizer for Linux

A sump pump monitoring system using Python and Raspberry Pi

Export helm stats into the Prometheus format

A Grafana datasource plugin for Apache Kafka

Display Contact Form 7 response messages as an alternative the standard alert dialog.

Integrates Affiliates, Affiliates Pro and Affiliates Enterprise with Ninja Forms.

Blocks spammers sending contact forms using an email address from the domain of the WordPress installation in Contact Form 7.
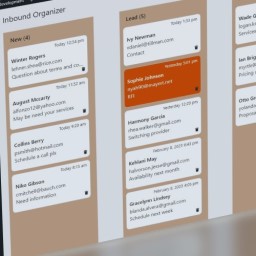
Inbound messages from Contact Form 7 are organized on a board with 2 to 5 columns to track message processing. Depends on CF7 and Flamingo.